|
Maps, Figures and Facility StatisticsThis section presents typical Dutch bicycling maps and designs of Dutch bike paths following some statistics of bycycling in The Netherlands |
||||||||||||||||||||||||||||||||||||||||||||||||||||||||||||||||||||||||||||||||||||||||||||||||||||||||
|
GO TO: Home - Bike Lanes - Bike Paths - Bike Parking - In the Countryside - Other ___________________________________________________________________________ IN PROGRESS - Comparing bicycling statisics between The Netherlands & USA (population density comparisons at end to help consider whether claims that the USA is too sparsely populated to achieve higher bicycle use) Mode Share (ground transport) % of all trips by bicycle:
Length of bike paths, cycleways, and bike lanes
median government spending per capita on bicycling facilities:
annual bicycle traffic fatalities:
bicycle (&car) ownership and use
Obesity Rates
Population (2009) and population density:
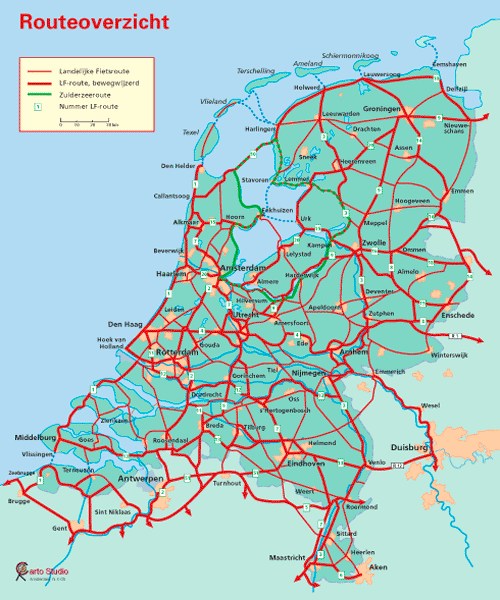
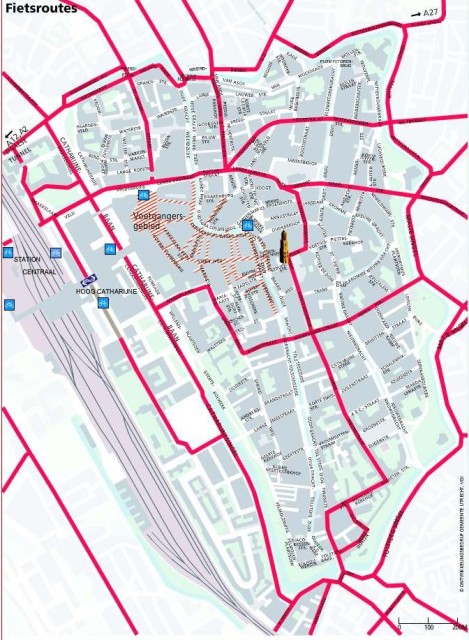
___________________________________________________________________________ Below - A map of long distance routes which are numbered and described in guidebooks (bold) and other marked routes combining paths parallel to roads and recreational paths along canals and through the countryside. For perspective, The Netherlands is about as large as MA, CT and RI combined or twice the size of NJ Three typical bike maps depicting "separate" bike paths in purple and long-distance bike routes in red. This map does not specifically show bike paths parallel to roads or roads with bike lanes which would include all the principal roads in yellow and some of the "white" roads as well (NOTE: each of these maps is about 6 miles by 6 miles. Source: www.pedbikeimages.org) Below - a map of Utrecht (population, square miles) showing the separate bike routes into the city. Below - an example of bike paths as shown in this interactive South Holland Bike Route Planner tool: www.zuid-holland.nl/popup-ROUTEPLANNER. As with most Dutch biking maps, only separated paths are shown, bike lanes are usually not. Below - to be added
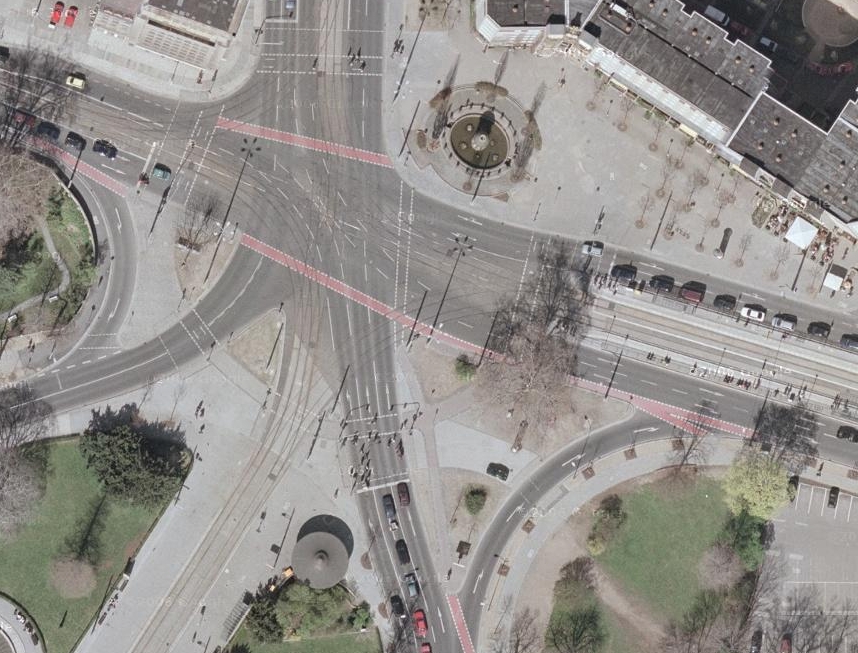
Below - aerial photo of a busy intersection in Dresden (Germany, not The Netherlands) with trolleys/trams, multiple car lanes. The larger roads have bikeways between the pedestrian sidewalk and the cars that can't be differentiated here but the red bike lanes when bike must interact with cars are obvious.
Below - to be added Below - to be added
Below - to be added Below - to be added Below left - to be added Below right - "to be added Next Gallery-Maps, Figures & Statistics Statistics references: http://www.rijkswaterstaat.nl/dvs/Images/Road%20safety%20in%20the%20NL%20key%20figures%202007_tcm178-237832.pdf Passenger Transport in the Netherlands, Rijkswaterstat, 2003 http://www.peoplepoweredmovement.org/site/index.php/site/media/investing_in_biking_and_walking_could_save_lives_says_report/ |